
Syntho’s quality assurance report assesses generated synthetic data and demonstrates the accuracy, privacy, and speed of the synthetic data compared to the original data.
At Syntho, we understand the importance of reliable and accurate synthetic data. That’s why we provide a comprehensive quality assurance report for every synthetic data run. Our quality report includes various metrics such as distributions, correlations, multivariate distributions, privacy metrics, and more. This way, you can easily assess that the synthetic data we provide is of the highest quality and can be used with the same level of accuracy and reliability as your original data.
Capturing a glimpse: this section illustrates highlights from our synthetic data quality report. Our assessments examine the synthetic data in comparison with the real data across various dimensions.
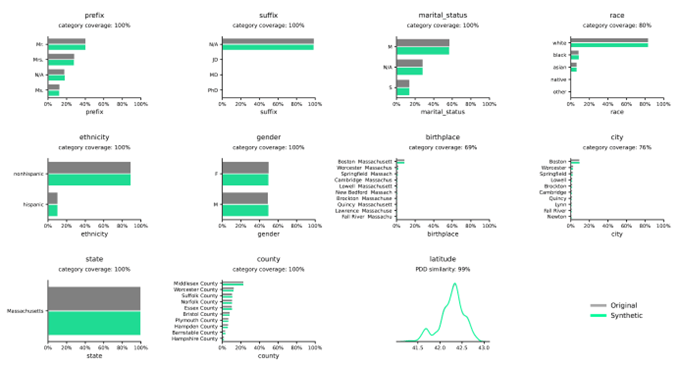
Synthetic Data Distributions in comparison to real data
Distributions illustrate the frequency of variables within given categories or values and are accurately captured by the Syntho Engine.
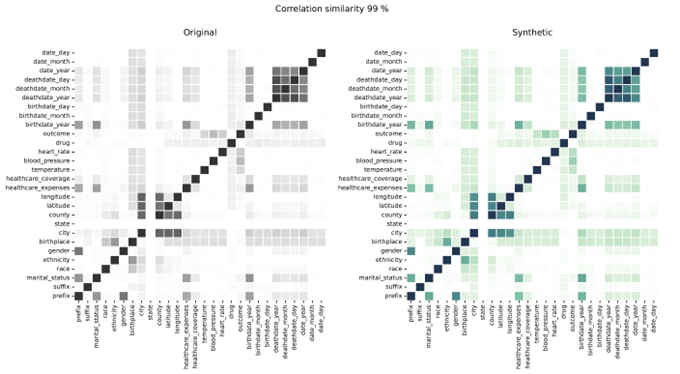
Synthetic Data Correlations in comparison to real data
Correlations show the relationship between variables, illustrating the degree to which variables are related. The Syntho Engine accurately captures these relationships.
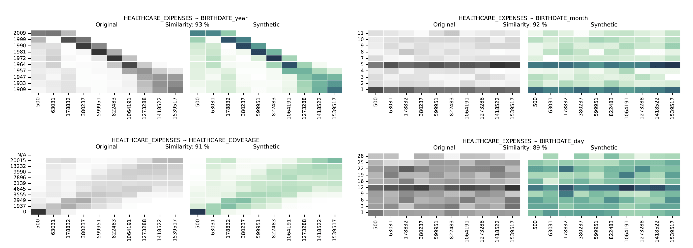
Synthetic Data Multivariate Distributions in comparison to real data
Multivariate distributions and multivariate correlations take us beyond singular dimensions, providing a comprehensive view of how multiple variables are related. The Syntho Engine captures these relations.
Synthetic data generation is complex and pitfalls do exist and have to be controlled for. With AI algorithms, overfitting is a risk and this is also the case for synthetic data generation with AI. Hence, one should control for the risk of overfitting when generating synthetic data. The risk of overfitting is controlled for in the Syntho Engine. On top of that, the Syntho Quality Assurance (QA) report allows organizations to demonstrate the synthetic data did not overfit on the original data. We also assess on more privacy related aspect, which are often used by internal auditors.
Test on “Exact matches” with the Identical Match Ratio (IMR)
Demonstration that the ratio of the synthetic data records that match a real record from the original data is not significantly greater than the ratio that can be expected when analyzing the train data.
Test on “Similar matches” with the Distance to Closest Record (DCR)
Demonstration that the normalized distance for synthetic data records to their nearest actual record within the original data is not significantly closer than the distance that can be expected when analyzing the train data.
Test on “Outliers” with the Nearest Neighbour Distance Ratio (NNDR)
Demonstration that the distance ratio between the nearest and second-nearest synthetic record to their closest record within the original data is not significantly closer than the ratio that is to be expected for the train data.
This is only a snapshot that summarizes the essence of our synthetic data quality exploration and quality assurance report. It offers a nuanced understanding of distributions, correlations, and multivariate distributions as part of synthetic data as captured by the advanced capabilities of the Syntho Engine. More details on our quality assurance report are available on request.